Date: May 14, 2026 Data Source: Last 1 year of daily price data (Yahoo Finance)
Today’s Signal Summary
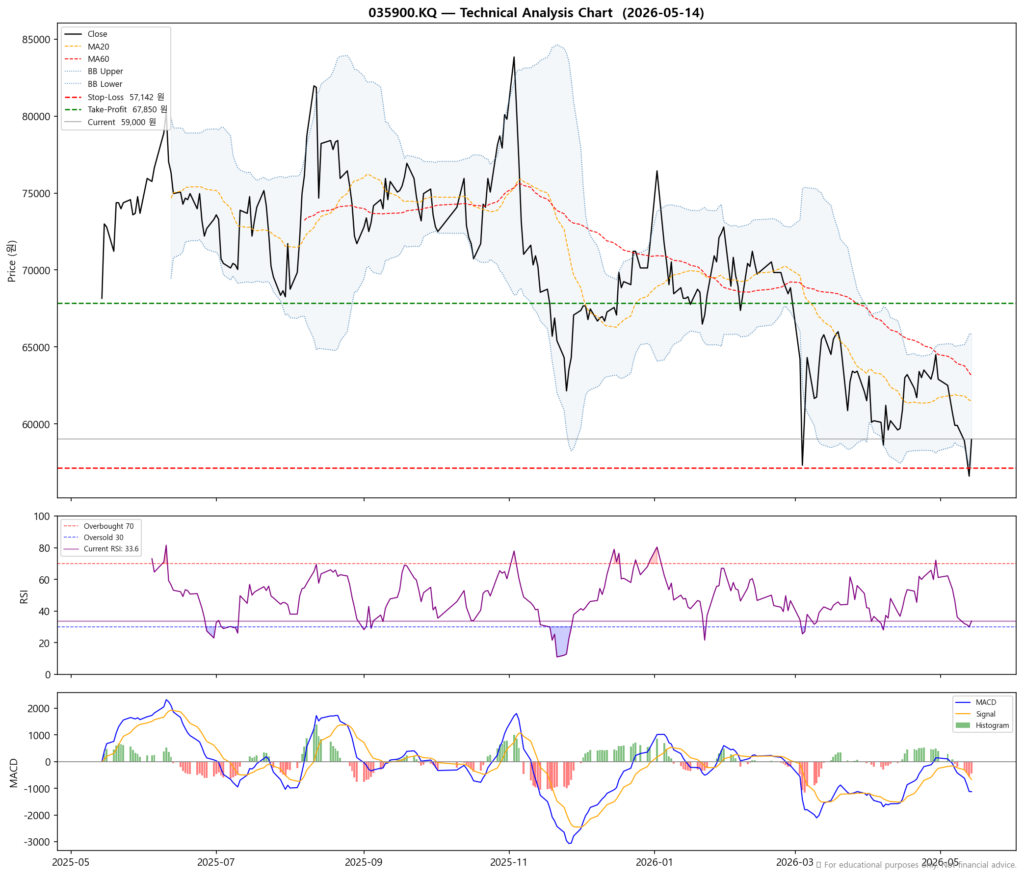
As of May 14, 2026, JYP Ent. shows a 🟡 Neutral / Watch signal (Score: +0/6). Rsi at 33.6 signals an oversold condition — a potential rebound opportunity, and price sits within the Bollinger Bands (21% from the lower band). Death Cross in place (bearish trend) / MACD shows weakening momentum. Based on technical analysis, the suggested Stop-Loss is 57,142 KRW and Take-Profit is 67,850 KRW.
Executive Summary
| Metric | Value |
|---|---|
| Current Price | 59,000 KRW |
| Signal | 🟡 Neutral / Watch |
| RSI | 33.6 |
| Bollinger Position | 21% from lower band |
| Moving Average | MA20 < MA60 — Death Cross (Bearish) |
| MACD | Below Signal Line (Bearish) |
| Composite Score | +0 / 6 |
Stop-Loss / Take-Profit Levels
| Level | Price (KRW) | vs. Current |
|---|---|---|
| Current Price | 59,000 | — |
| 🛑 Stop-Loss | 57,142 | -3.1% |
| 🎯 Take-Profit | 67,850 | +15.0% |
| 📐 Risk/Reward | 1 : 4.8 | — |
Methodology
- Stop-Loss: Higher of Bollinger Lower Band (57,142 KRW) or −5% from current price (56,050 KRW)
- Take-Profit: Lower of Bollinger Upper Band (65,868 KRW) or +10% from current price (64,900 KRW)
- If RSI > 65, Take-Profit is tightened to +5% to account for overbought conditions
Indicator Analysis
📉 RSI 33.6 — Oversold Zone (Bullish +2pts)
RSI (Relative Strength Index) measures recent price momentum on a 0–100 scale. At 33.6, the RSI is below 35, indicating the stock has been sold off aggressively in the short term. Historically, this zone tends to precede a price rebound, making it a bullish signal.
↔️ Within Bollinger Bands — 21% from lower band (0pts)
The price is within the normal Bollinger Band range (approaching support). At 21% from the lower band, the price is neither extended to the upside nor downside. Bollinger Bands use a 20-day rolling average ± 2 standard deviations.
🔻 Death Cross — MA20 below MA60 (Bearish -1pt)
The 20-day moving average is below the 60-day moving average, known as a Death Cross. Short-term price action is weaker than the longer-term trend, suggesting downward momentum. Be cautious of ‘dead cat bounces’ — temporary rallies within a downtrend.
⬇️ MACD below Signal Line (Bearish -1pt)
The MACD line is below its Signal line, indicating weakening price momentum. Caution is advised for new long positions. Watch for a bullish MACD crossover as a potential re-entry signal.
Disclaimer
⚠️ This report is for educational and informational purposes only. This is NOT financial advice. All investment decisions and their outcomes are solely the responsibility of the reader. Technical analysis is based on historical price data and does not guarantee future results. Always conduct your own due diligence and consult a licensed financial advisor before making investment decisions.