Date: April 30, 2026 Data Source: Last 1 year of daily price data (Yahoo Finance)
Today’s Signal Summary
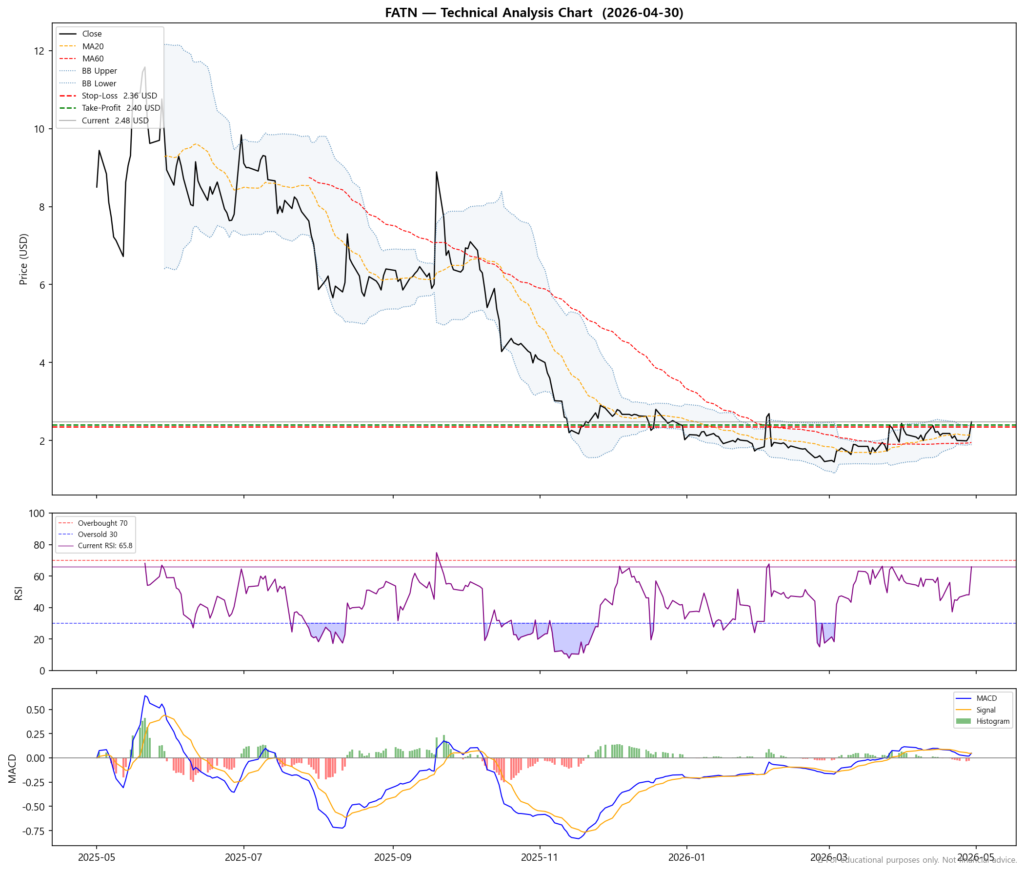
As of April 30, 2026, FatPipe, Inc. shows a 🟡 Neutral / Watch signal (Score: -2/6). Rsi at 65.8 indicates overbought territory — short-term caution advised, and price is at the Bollinger Upper Band, signaling short-term overextension. Golden Cross in place (bullish trend) / MACD confirms upward momentum. Based on technical analysis, the suggested Stop-Loss is 2.36 USD and Take-Profit is 2.40 USD.
Executive Summary
| Metric | Value |
|---|---|
| Current Price | 2.48 USD |
| Signal | 🟡 Neutral / Watch |
| RSI | 65.8 |
| Bollinger Position | 116% from lower band |
| Moving Average | MA20 > MA60 — Golden Cross (Bullish) |
| MACD | Above Signal Line (Bullish) |
| Composite Score | -2 / 6 |
Stop-Loss / Take-Profit Levels
| Level | Price (USD) | vs. Current |
|---|---|---|
| Current Price | 2.48 | — |
| 🛑 Stop-Loss | 2.36 | -5.0% |
| 🎯 Take-Profit | 2.40 | +-3.3% |
| 📐 Risk/Reward | 1 : 0.7 | — |
Methodology
- Stop-Loss: Higher of Bollinger Lower Band (1.89 USD) or −5% from current price (2.36 USD)
- Take-Profit: Lower of Bollinger Upper Band (2.40 USD) or +10% from current price (2.73 USD)
- If RSI > 65, Take-Profit is tightened to +5% to account for overbought conditions
Indicator Analysis
📈 RSI 65.8 — Overbought Zone (Bearish -2pts)
RSI at 65.8 exceeds 65, signaling the stock has risen sharply in the short term. Upward momentum may be exhausting and a pullback or consolidation is more likely. Note: in strong uptrends, RSI can remain elevated for extended periods.
📈 Price at Bollinger Upper Band (Bearish -2pts)
The current price is at or above the Bollinger Upper Band. This indicates the stock is trading at the top of its normal range and may face resistance. A pullback toward the midline (MA20) is statistically common from this zone.
🟰 Golden Cross — MA20 above MA60 (Bullish +1pt)
The 20-day moving average is above the 60-day moving average, known as a Golden Cross. This indicates that the short-term price trend is stronger than the longer-term trend — a bullish momentum signal. Golden Cross patterns are widely watched by technical traders as a buy confirmation.
⬆️ MACD above Signal Line (Bullish +1pt)
The MACD line (12-day EMA minus 26-day EMA) is above its 9-day Signal line. This indicates strengthening upward momentum. The signal is strongest when the two lines have recently crossed upward.
Disclaimer
⚠️ This report is for educational and informational purposes only. This is NOT financial advice. All investment decisions and their outcomes are solely the responsibility of the reader. Technical analysis is based on historical price data and does not guarantee future results. Always conduct your own due diligence and consult a licensed financial advisor before making investment decisions.