Date: April 26, 2026
Data Source: Last 1 year of daily price data (Yahoo Finance)
Today’s Signal Summary
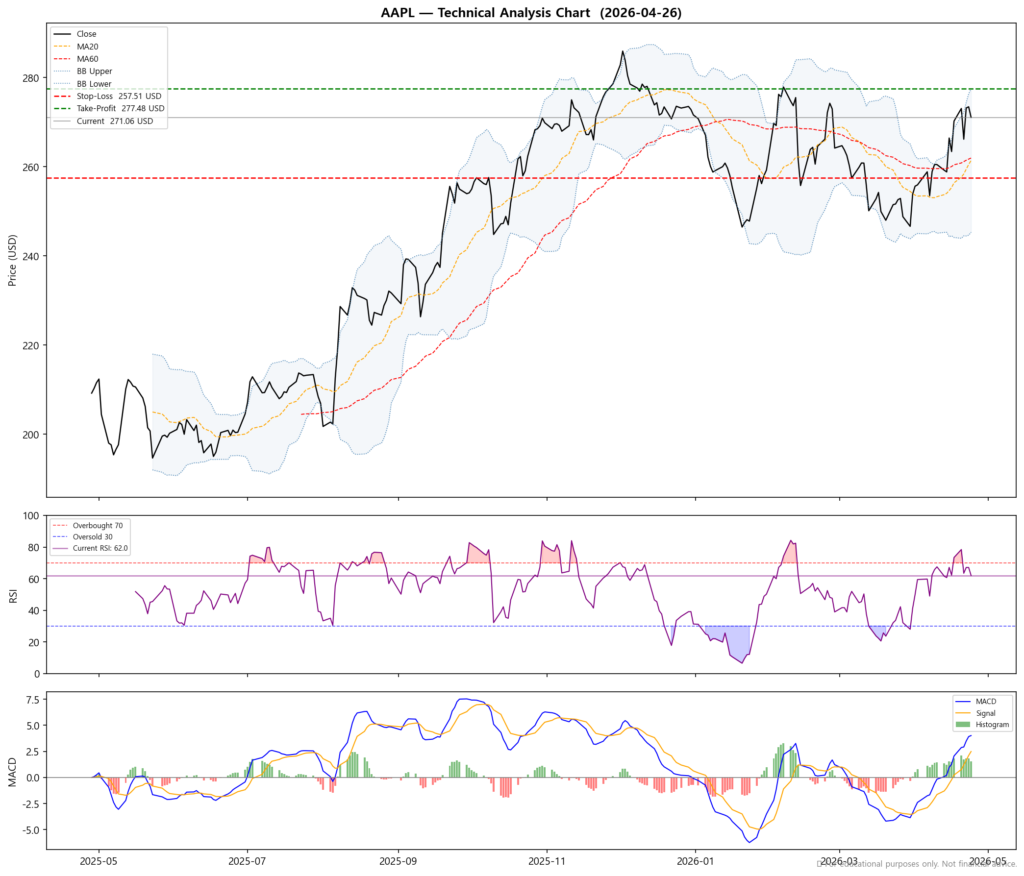
As of April 26, 2026, AAPL shows a 🟡 Neutral / Watch signal (Score: +0/6). Rsi at 62.0 is in neutral territory, and price sits within the Bollinger Bands (80% from the lower band). Death Cross in place (bearish trend) / MACD confirms upward momentum. Based on technical analysis, the suggested Stop-Loss is 257.51 USD and Take-Profit is 277.48 USD.
Executive Summary
| Metric | Value |
|---|---|
| Current Price | 271.06 USD |
| Signal | 🟡 Neutral / Watch |
| RSI | 62.0 |
| Bollinger Position | 80% from lower band |
| Moving Average | MA20 < MA60 — Death Cross (Bearish) |
| MACD | Above Signal Line (Bullish) |
| Composite Score | +0 / 6 |
Stop-Loss / Take-Profit Levels
| Level | Price (USD) | vs. Current |
|---|---|---|
| Current Price | 271.06 | — |
| 🛑 Stop-Loss | 257.51 | -5.0% |
| 🎯 Take-Profit | 277.48 | +2.4% |
| 📐 Risk/Reward | 1 : 0.5 | — |
Methodology
- Stop-Loss: Higher of Bollinger Lower Band (245.32 USD) or −5% from current price (257.51 USD)
- Take-Profit: Lower of Bollinger Upper Band (277.48 USD) or +10% from current price (298.17 USD)
- If RSI > 65, Take-Profit is tightened to +5% to account for overbought conditions
Indicator Analysis
➡️ RSI 62.0 — Neutral Zone (0pts)
RSI at 62.0 sits in the neutral range (35–65), suggesting neither overbought nor oversold conditions. No strong directional signal from RSI alone; use in conjunction with other indicators.
↔️ Within Bollinger Bands — 80% from lower band (0pts)
The price is within the normal Bollinger Band range (approaching resistance). At 80% from the lower band, the price is neither extended to the upside nor downside. Bollinger Bands use a 20-day rolling average ± 2 standard deviations.
🔻 Death Cross — MA20 below MA60 (Bearish -1pt)
The 20-day moving average is below the 60-day moving average, known as a Death Cross. Short-term price action is weaker than the longer-term trend, suggesting downward momentum. Be cautious of ‘dead cat bounces’ — temporary rallies within a downtrend.
⬆️ MACD above Signal Line (Bullish +1pt)
The MACD line (12-day EMA minus 26-day EMA) is above its 9-day Signal line. This indicates strengthening upward momentum. The signal is strongest when the two lines have recently crossed upward.
Disclaimer
⚠️ This report is for educational and informational purposes only. This is NOT financial advice. All investment decisions and their outcomes are solely the responsibility of the reader. Technical analysis is based on historical price data and does not guarantee future results. Always conduct your own due diligence and consult a licensed financial advisor before making investment decisions.